Overview analytics
Quickly get an overview on the activity of your organization. Gain insights on sessions, document views, user activity and group activity.
Who is this for?
👤 Administrators
👁️🗨️ Available for all subscription plans
In this article
Graph for Sessions, active users and document views
Overview analytics
Overview analytics provides a convenient and efficient way to quickly view the most relevant data at a glance. It allows you to gain insights into how your Showell Workspace is being utilized and provides a comprehensive overview of user and group activity./Web%20Analytics.webp?width=670&height=385&name=Web%20Analytics.webp)
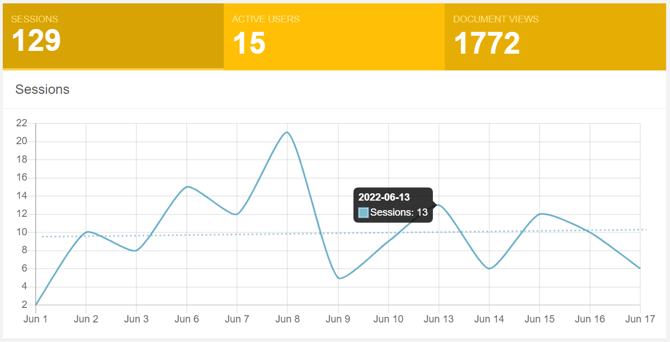
By utilizing the Overview analytics feature, you can easily track and monitor the activity of your Workspace's users and groups. This includes valuable information such as the number of sessions, active users, and document views. By simply clicking on the corresponding graphs, you can access more detailed information about each metric.
Find your analytics in:
- Showell App for Web > Admin-tab in the side menu > Analytics > Overview
Graph for Sessions, Active users and document views

Sessions:
Find out how many times all your users have used the Showell Workspace
Click 'Sessions' to see its graph > By hovering the graph line, you can see the sessions for each individual day
Active Users:
Find out how many users have used Showell
Click 'Active Users' to see its graph > By hovering the graph line, you can see how many users have been active on individual days
Document Views:
Find out the total amount of documents viewed
Click 'Document Views' to see the its graph > By hovering the graph line, you can see the amount of documents viewed on an individual day
Document Views

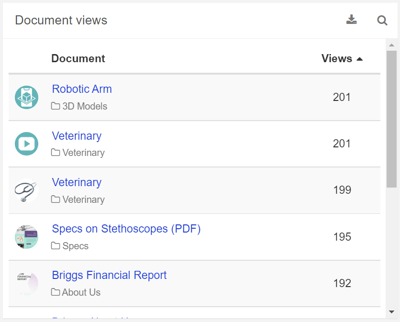
Gain deeper insights into the most frequently viewed documents and their usage trends compared to the previous period. This analysis helps you identify the materials that are most valuable to your organization and those that are less frequently utilized.
Document: A list of all your files. When clicking a file/document, you will be able to see it's individual content analytics
Views: Discover quickly how many times a file is used
Trend: Visible when selecting the 'last 30 days', you can see how it compares to the 30 days before that
User activity

Utilize the User Analytics to track your users' engagement with Showell. Gain insights into their activity by determining the amount of time they spend using the platform, the number of document shares they have made, and how frequently they have viewed your content.
User: A list of all your active users (UUP). When clicking a user's name, you will be able to see their individual user analytics
Time spent: Find out how long a user has spent time using Showell
Sessions: Find out how many times a user has logged in to Showell
Shares: Learn how many shares the user has created
Views: The amount of documents the user has watched
Group activity

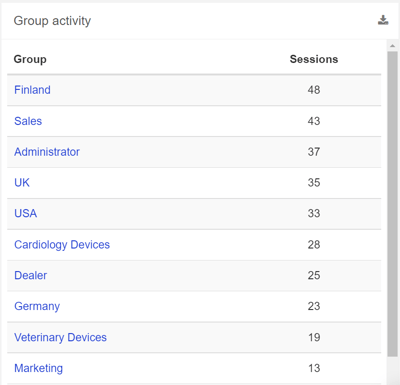
Utilize the Group Analytics feature to effectively compare and analyze different groups within your Showell Workspace. This allows you to gain valuable insights into the activity and engagement levels of each group.
Group: You can click a group to discover it's individual group analytics
Sessions: The amount of times the group users have logged in to Showell
💡 FAQ
Can I choose a different time frame for viewing the analytics?
In the top right corner of every analytics page you can choose the exact time period, or click the hamburger icon to quickly select the right time frame for your analytics.
Can I download analytics to my device?
Use the download button, available in most analytic sections, to get the information straight to your device in Excel (XLSX) file format.
Can I search within the analytics?
Use the magnifying glass, available in most analytic sections, to quickly find the information you need.
Why are some documents marked with 'Private'?
Documents marked with Private are part of the user's My Files.
Can I sort or organize the analytics?
Most of the column titles are clickable. This will sort the column's content alphabetically or numbers from high to low (click again to reverse the order).
Can our Workspace users remain anonymous?
Yes, you have the option to enable 'User pseudonymization'. This feature allows users to remain anonymous while still allowing you to track their activity. It is especially useful in countries where privacy laws restrict tracking user activity. If you would like to activate this feature, please reach out to your Showell contact person or contact Showell Support.
- What is the meaning of UUP in this article? UUP stands for 'Unavailable with User Pseudonymization', which indicates that Analytics are unavailable when the User pseudonymization feature is enabled.
How long does it take for Analytics data to be updated?
The availability of share analytics data may take 15 to 30 minutes. For Share analytics data in SalesForce, it may take 30 to 60 minutes. Other analytics data may take 2 to 4 hours to become available.