User analytics
With Analytics you can identify trends on content usage, user activity and group performance in the past days, weeks, months or years.
User analytics
With User Analytics, you can track how much time your users spend using Showell, the number of document shares they have made, and how many times they have viewed your content. This feature allows you to compare users to each other and view data on individual users. It helps you identify if any users are struggling with Showell and if they could benefit from additional guidance. Additionally, User Analytics enables you to identify users who are highly active on Showell and understand how their activity impacts their sales deals.
Find your analytics in:
- Showell App for Web > Admin-tab in the side menu > Analytics > Users
User activity
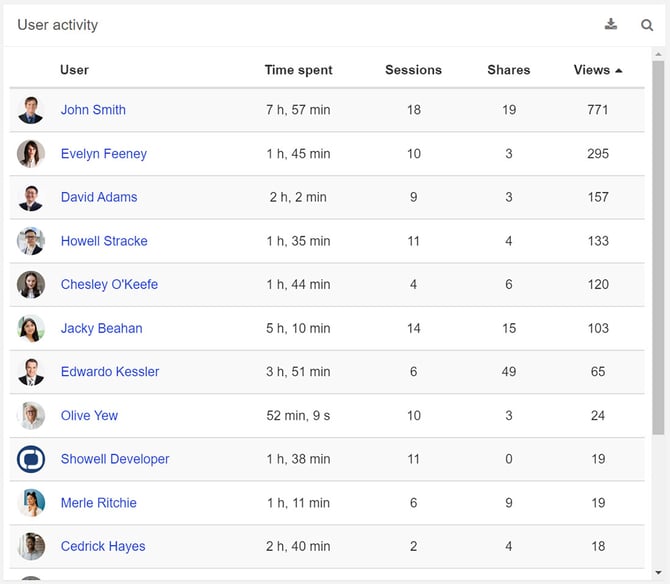
User: A list of all your active users. When clicking a user's name, you will be able to see their individual user analytics (UUP):
- Their amount of Sessions, Viewed documents and created shares
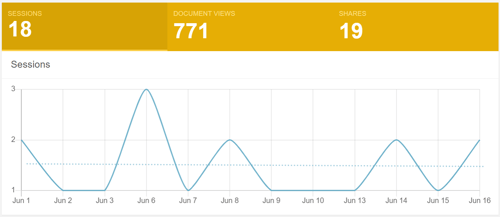
- Their document interactions
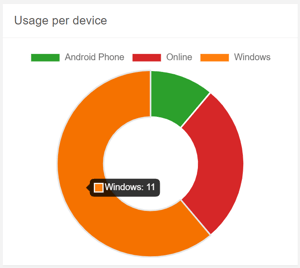
- Their usage per device: This indicated the amount of sessions per device
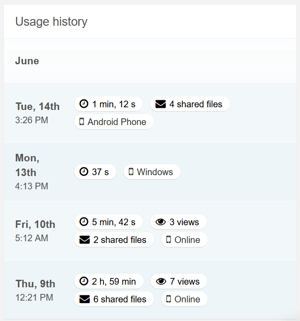
- Their usage history: When, how long session, amount of documents viewed, with what device and amount of shares
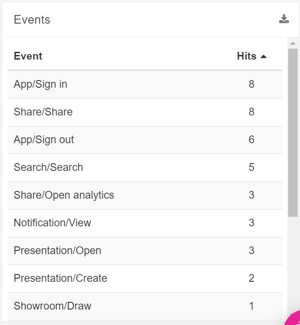
- Their events: All the events/actions taken by the user
Time spent: Find out how long a user has spent time using Showell
Sessions: Find out how many times a user has logged in to Showell
Shares: Learn how many shares the user has created
Views: The amount of documents the user has watched
View and compare users (UUP)
Quickly view one or compare multiple user or group analytics at once.
1. Type the users or group names

2. Select the correct user/group from the drop down menu, and feel free to add as many users/groups as you like

3. You will now see only the selected users or groups in your 'User activity'
4. If you'd like to remove a user/group, simply press the X next to the user/group name

Active users
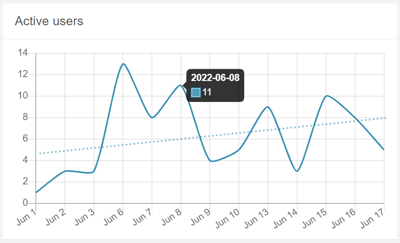
Discover the number of active users on any specific day. By simply hovering over the graph line, you can easily see the exact count of users who have been active on each individual day.
Usage per device
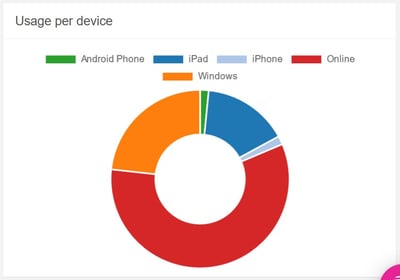
Discover which devices your users prefer to use the most. Simply hover over the different sections of the donut chart to see the amount of usage for each device.
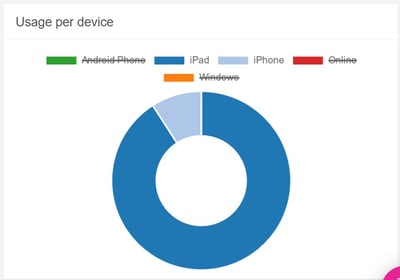
Click the platforms above the donut chart to exclude or add them.
💡 FAQ
Can I choose a different time frame for viewing the analytics?
In the top right corner of every analytics page you can choose the exact time period, or click the hamburger icon to quickly select the right time frame for your analytics.
Can I download analytics to my device?
Use the download button, available in most analytic sections, to get the information straight to your device in Excel (XLSX) file format.
Can I search within the analytics?
Use the magnifying glass, available in most analytic sections, to quickly find the information you need.
Why are some documents marked with 'Private'?
Documents marked with Private are part of the user's My Files.
Can I sort or organize the analytics?
Most of the column titles are clickable. This will sort the column's content alphabetically or numbers from high to low (click again to reverse the order).
Can our Workspace users remain anonymous?
Yes, you have the option to enable 'User pseudonymization'. This feature allows users to remain anonymous while still allowing you to track their activity. It is especially useful in countries where privacy laws restrict tracking user activity. If you would like to activate this feature, please reach out to your Showell contact person or contact Showell Support.
- What is the meaning of UUP in this article? UUP stands for 'Unavailable with User Pseudonymization', which indicates that Analytics are unavailable when the User pseudonymization feature is enabled.
How long does it take for Analytics data to be updated?
The availability of share analytics data may take 15 to 30 minutes. For Share analytics data in SalesForce, it may take 30 to 60 minutes. Other analytics data may take 2 to 4 hours to become available.
/User%20analytics%20Web.webp?width=670&height=385&name=User%20analytics%20Web.webp)